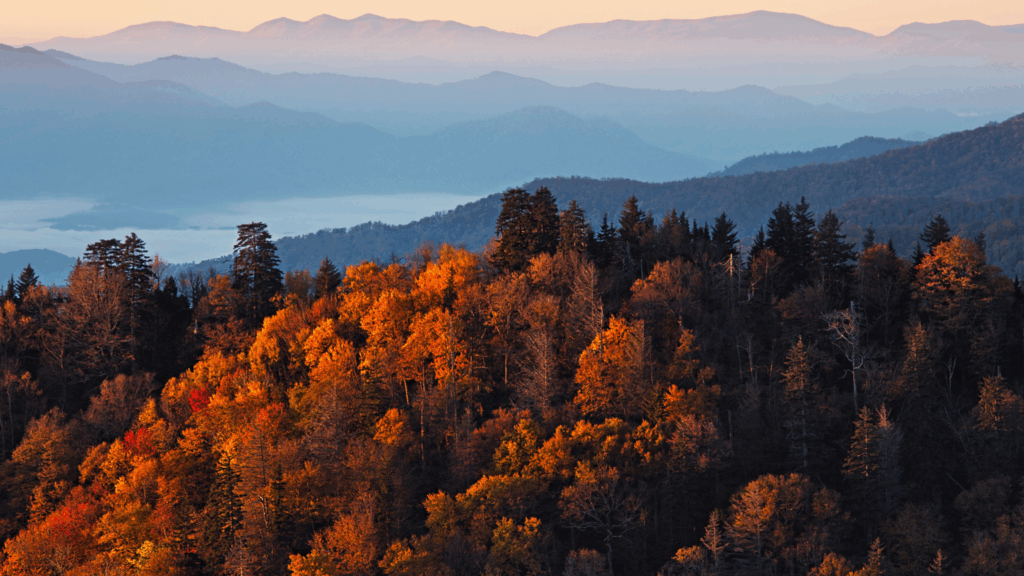
A Smarter Way to Chase Peak Color
Yes, there is a live map that tracks fall color across the United States, and it updates every day. This tool was launched in 2024 with one goal: to make leaf peeping easier by replacing guesswork with timely data. The team built an in-house AI model that learns from daylight length, temperature swings, and on-the-ground reports to predict where color is building and when it will peak. Think of it as a weather forecast for leaves. The current model is about 80 percent accurate within a three-day window, which is more than enough to lock in your weekend plans with confidence.
How the Map Works
Explore Fall’s system blends two kinds of information. First, it uses deep learning to analyze seasonal signals like cooling nights and shorter days that push trees to change. Second, it pulls real-time observations from people around the country. Those fresh check-ins help the model correct itself quickly if a cold snap or heat wave speeds things up or slows things down. The result is a map that does not freeze after one update. It keeps learning all season.
Two Views You Will Use Most
When you open the site, you will see two main settings. Each answers a different question.
Color Report
Use this when you want to know what the leaves look like right now. The map labels every area with one of six stages: little to no color, low color, moderate color, high color, peak color, and past peak color. Click the map on the homepage, zoom in on your region, and you will get a block-by-block feel for how vibrant the canopy is today. It is perfect for choosing between two nearby parks or deciding whether to drive an extra hour.
Peak Timing
Switch to this view when you are planning a future trip. Peak Timing shows the best week to visit different parts of the country. For example, Maine usually lights up in early to mid-October. South Carolina tends to shine from early to late November depending on elevation and where you go in the state. This mode helps you pick dates first, then layer on routes, hotels, and hikes.
Planning Tips That Make a Difference
Explore Fall recommends setting your plans about two weeks in advance. That buffer gives you time to dodge a rainy system that might dull color or knock leaves down early. Check the Color Report a few days before you go and again the night before you leave. If a cold front or warm spell shifts the forecast, you can pivot to a nearby county that is closer to peak. If you plan to photograph, aim for early mornings after a cool clear night. Colors look richer and crowds are lighter.
What Else Is On the Site
The Explore Fall blog is worth a read if you like the science behind the scenery. One standout post explains the stress outlook, a simple way to see how unusual weather can push trees to drop leaves earlier or hang on longer. You will also find a global fall foliage section that tracks color in other countries if you are planning an international trip. Both resources add context so you can understand why your favorite trail pops one year and lags the next.
Quick Start Checklist
- Open the map and choose Color Report for current conditions
- Switch to Peak Timing to pick future dates by region
- Zoom in to compare nearby parks and scenic byways
- Recheck conditions three days before you go to catch last-minute shifts
- Build a backup stop within a one-hour drive in case weather changes the plan
The Bottom Line
Explore Fall’s map turns leaf peeping into a simple, data-guided adventure. With daily updates, an AI model that learns as the season unfolds, and two clear ways to view conditions, you can stop guessing and start exploring. Use Peak Timing to choose your week, use Color Report to pick your trail, and enjoy the kind of autumn day that feels perfectly timed.